Measuring User Experience; Getting real value from your UX metrics
User Experience & Usability
Our client provides an internet booking engine to travel companies, which involves giving them tools, content and services to support their e-commerce strategies. In partnership with one of the travel companies they were working with, our client wanted to identify trackable user experience metrics to better understand the effect of business and design decisions on the user experience. They already tracked a number of metrics, but felt they weren’t getting real value from them. They wanted to identify the right metrics to be able to meaningfully interpret and monitor data going forward.
Workshop time! We planned a workshop to help our client and their customer identify and agree a set of key metrics. It was promoted internally as a ‘Data Sprint’ due to the existing buy-in to the Sprint process. Call it what you want… data sprint, metrics workshop… we were working through a LOT of information. Quickly!
Here’s what we did
The workshop combined the Goals-Signals-Metrics process and Google’s HEART framework. These are the steps we took.
What’s the goal? The Goals-Signals-Metrics process involves identifying the goals of a product or feature, identifying the signals that indicate success, and then building specific metrics to track and measure the extent of that success (or not!).
We started from our existing customer journey map that documented the end customers’ travel journey, from seeking inspiration though to returning home, sharing their experience and thinking about their next trip. We also considered four personas that matched the travel company’s end customers.
The map and personas were the result of our previous research activities with our client, but if you don’t already have a customer journey map, you could include an exercise to create a high-level map using the Note-n-map exercise from the Sprint 2.0 methodology. And, if you don’t already have personas, you could include a quick proto-persona exercise here too.
Working through the end-to-end journey, we identified ‘goals’ at each stage of the journey, thinking about what our client and their customer were trying to help travellers do, and what problems they were trying to solve. An example goal might be:
GOAL: ‘Users are happy with the process of booking a flight online’.
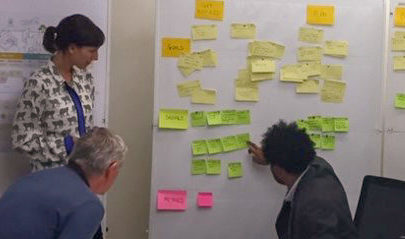
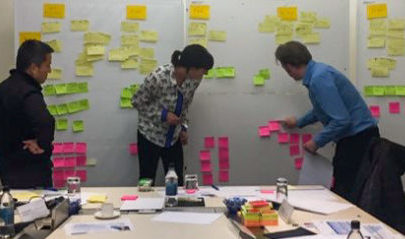
The team were tasked to familiarise themselves with their assigned persona and work through the traveller journey map stages, writing down the goals on yellow post-its for each stage of the journey. The goals were stuck up on the walls in sequence on the traveller customer journey map, and any duplicates were grouped. We walked through the goals, collaboratively fine-tuning and agreeing them as we went.
Having identified the goals, we considered what changes in user behaviour or opinion would indicate they had been successful in achieving their goals. These changes in behaviour or opinion are referred to as ‘signals’, and there may be more than one signal per goal.
Thinking back to our earlier example of a goal, a signal that they have achieved their goal might be:
GOAL: Users are happy with the process of booking a flight online
We determined how to measure the size in any change to the previously identified signals and mapped these metrics onto the journey map. This activity centred on the HEART framework, with participants focussing on a different category of Metric, be it Happiness, Engagement, Adoption & Retention or Task Success metrics. We have included some useful links at the end of this article in case you want to find out more about the HEART Framework.
Working through the journey, taking into account the Goals and Signals, the team made notes of possible metrics that would measure the change in signals. Each pair presented their metrics to the group and placed them along the journey, whilst the rest of the group checked if anything was missing.
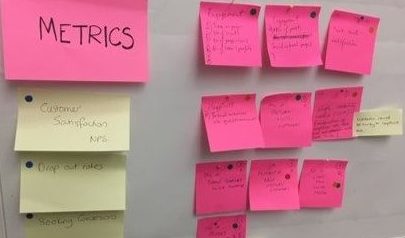
A quick vote: Having agreed on and documented possible UX metrics, we conducted an activity to start to understand how easy these metrics would be to measure. We placed green dot stickers on metrics they ‘already have and are easy to measure’, yellow dot stickers on metrics they could ‘get the information on, but will need to fine-tune’ and red dots on metrics they ‘ don’t currently capture and would need to invest time in developing’.
We then went on to run a dot vote exercise, whereby each stakeholder was given three blue dots to vote on their priorities for metrics to measure going forward. They were able to place dots on three different metrics they felt were a priority to track to inform the performance of the user experience, or put all three of their dots on the metric they felt was really important.
The outcome
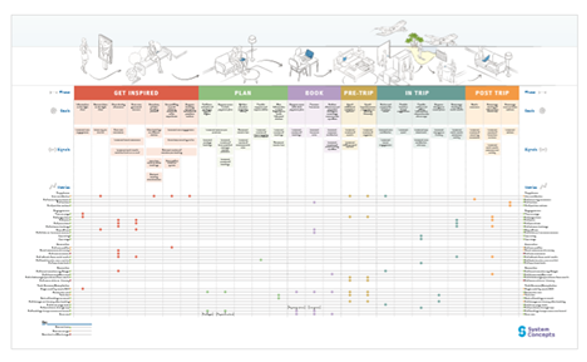
The workshop output was summarised in a UX metrics map that documented the metrics, goals, signals and corresponding moments in the customer journey. The map helped our client and their customer stay focused on the metrics that were closely related to the customer journey and their goals.
“No matter how user-centered a metric is, it is unlikely to be useful in practice unless it explicitly relates to a goal, and can be used to track progress towards that goal.” (Rodden et al.)
The collaborative approach, shared understanding and agreement helped bring efficiencies and value to the metrics they were capturing. It set the foundations for their strategy for measuring the user experience of the booking engine over time, to better understand the effect of business and design decisions in the future.
Our design sprints are based on Jake Knapp’s methods and are collaborative processes for validating ideas and tackling challenges through ...
Our design sprints are based on Jake Knapp’s methods and are collaborative processes for validating ideas and tackling challenges through prototyping and testing. Let’s just say they are fun...
UX design sprint accelerates digital product development when Amadeus, the leading IT solution supplier to the global travel industry, was looking to ...
UX design sprint accelerates digital product development when Amadeus, the leading IT solution supplier to the global travel industry, was looking to rapidly take a new business concept to market...
An important part of our strategy at System Concepts is to approach all of our challenges creatively. We explore depth, richness, and complexity ...
An important part of our strategy at System Concepts is to approach all of our challenges creatively. We explore depth, richness, and complexity before applying our specialist UX design skills to...
 Get help running your own workshop