How mental models enhance usability
How drawing can aid the usability research process
We take a look at the use of mental models – and how drawing can be a useful part of a usability researcher’s armoury.
A lot of usability issues are the result of a mismatch between the mental model of the users, and the conceptual model that a design is using to relay and organise information. Conversely, designs that feel intuitive to use often closely match the mental model of the user.
A person’s mental model is simply how they think information is going to be organised and displayed. If you were asked what steps you expect to take on a shopping website, you would probably give a breakdown something like this:
- Search or browse for the item
- Read further details about it, possibly look at bigger pictures
- Select the item (add it to a shopping basket)
- Say you want to pay and set a delivery address
- Enter card details
- Get a confirmation screen.
This is the rough mental model that many people are likely to have for a shopping website. It is a mixture of past experience with online shopping (e.g. Amazon) and past experience with physical shops. You put items in a shopping basket when walking around a supermarket. If a shopping website asked you to enter your credit card details before you even got to look at the products it sold you would be less likely to use it, because it is not organised as you expect.
Intuitive and simple?
An intuitive system is not necessarily simple. A design can be complex and require multiple steps, but if the organisation of the service is similar to the user’s expectations, it can be an intuitive and ‘easy to use’ service.
Gaining an understanding of people’s mental models is therefore key to creating a service that ‘just works’. The factors involved may appear very simple, but actually require a lot of analysis and understanding to capture.
Drawing can help
Trying to explain to a researcher how you expect something to be organised can be quite difficult: especially when it’s an unusual and unfamiliar task. Drawing can really help research participants to do this.
By getting users to draw out how they think things may be organised, they are forced to operate in the physical world. They can see on paper the relationships they are creating between items, because they now have a physical form and are spatially linked to each other.
Examples of mental models in practice: Google
Example 1: Google maps
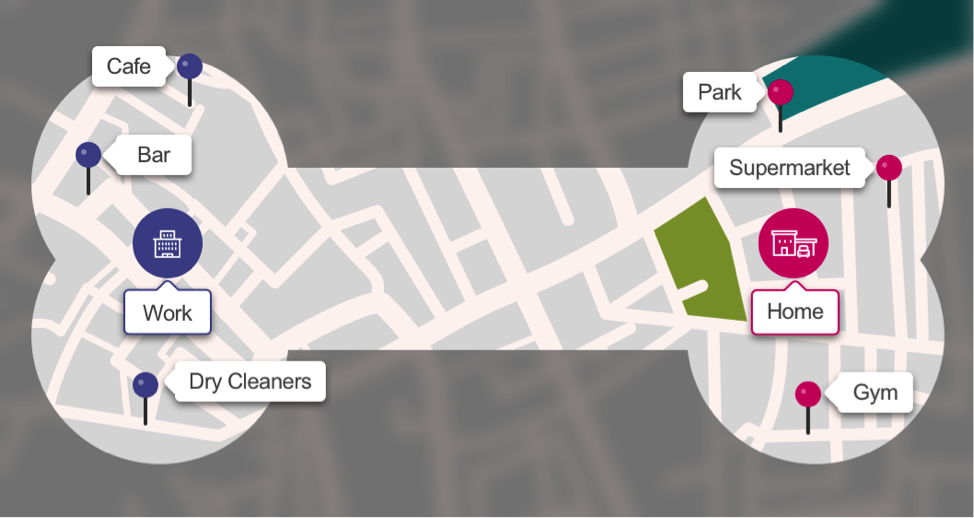
In 2008, Google had a hypothesis that when it came to Google Maps and what information people wanted about what was around them, they would like to circle their current location or other common places they spent time at. Basically the user would not want to travel very far, and if using a mobile, not very far from their current location. So if they searched for a dry-cleaner they wanted a dry cleaner near where they currently were.
Google wanted to know how people explore their environment, how they find new bars, new shops to try, etc. And what are their limits: would they drive two hours for a ‘5 star’ ice-cream?
Users draw their week
To understand this, Google got users to draw their typical week – the places they go and the things they do. They then asked them to plot on a map where they go. This revealed that people move around their environment in a fairly common ‘dog bone’ pattern linked to their home and work.
People do not want to explore as far out as Google expected, and they also have certain anchors (home and work) around which they operate. An interesting bar half way between home or work is less appealing than an interesting bar close to the office.
Example 2: The power of friendship groups in social media
Drawing was also instrumental in the way Google came up with the idea for G+ circles, and influenced other social media platforms such as Facebook.
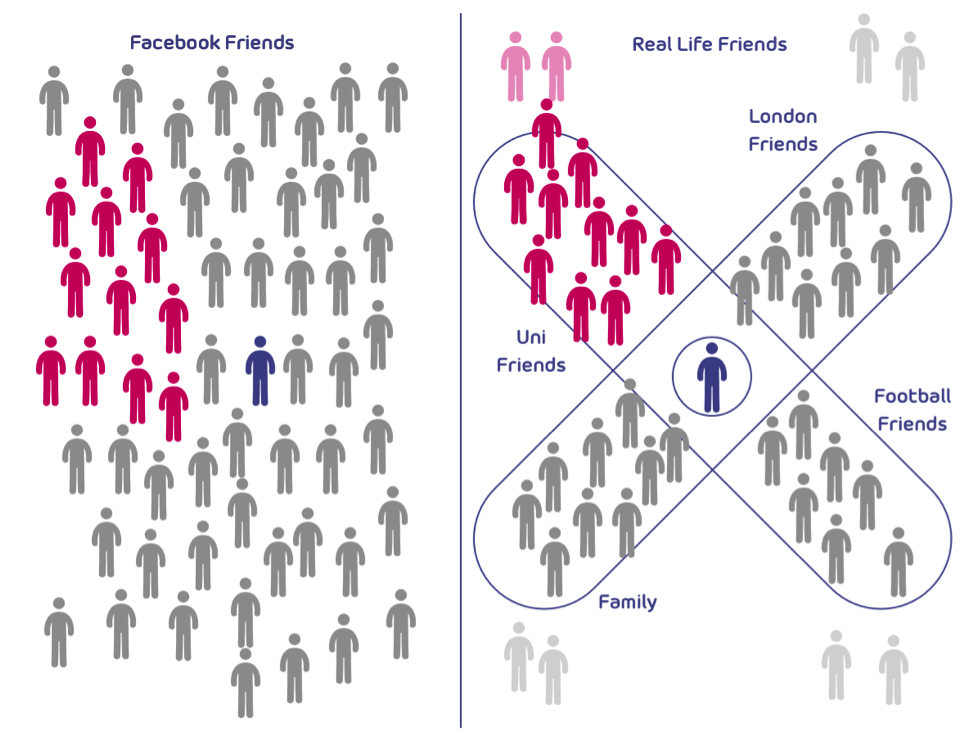
Google asked users to draw themselves at the centre, with their friends around them, using physical proximity to show how close a friend they were. At the time, Facebook depicted all a user’s friends in one pot.
Google research showed that people think of their friends in different groups. This was a revolutionary discovery for social media and led to the introduction of ‘groups’ for Facebook.
This demonstrates the power drawing can have as a research tool. That we put our friends in groups seems obvious and would be intuitive to use within a social media tool. We have work friends, who we might want to organise going out for a drink with. And university friends who we might try to meet up with once or twice a year.
We do not often mix these groups so think of them as separate entities. It fits our mental model of our friends – but until Google undertook this research, it was not how social media tools were organised.
While the same information would doubtless have been found by talking to people, it would have been less obvious and taken more time to discover: it was thinking spatially that yielded the valuable finding so effectively.
Using mental models in organisations
Mental models are not just linked to users and products. Companies also use them internally, as mismatches between people’s mental models can cause organisational issues.
If your company provides a service, how you think about that service may be very different to how a colleague in a different role thinks about it. You may use different language to describe it, and even think it does entirely different things, which can cause internal confusion. Having a mental model of a service that is consistent across an organisation enhances communication and understanding.
How to do it:
To use mental models, first decide at a high level what it is you actually want to understand about your users or your company. This needs to be a clear question which you can actually work towards answering, such as:
- How do people find a route from home to work?
- What steps do people think are required to achieve X?
- How do people think these different parts are related, or are they not related at all?
Second, come up with a few clear, open-ended questions to prompt people to start drawing about what you are interested in, such as:
- Describe how X works and draw me a simple diagram of how it is organised.
- Show me how and where you use your phone on an average day.
- Describe the steps you would expect to take when booking a holiday.
- Describe how you and a friend would choose where to meet for dinner.
Third, use follow up questions to gain further insight into what the participant is describing, such as:
- You said you look at price. What is ‘too much’ for you? Is there such a thing as ‘too cheap’?
- You looked at taxis and walking time. You seemed to ignore buses: why?
Fourth, analyse the outputs and look for behaviour patterns.
It’s fast, effective and only needs pen and paper
Drawing is a quick and cheap way to get a lot of information out of people’s minds and on to paper. The quality of the drawing is irrelevant. For mental models we are interested in relationships and understanding.
Give it a go and if you find it useful, we would love to hear what you discovered.

Contact our usability specialists with your challenge


